SSTAR is applied to detect and track diffuse thermal signals associated with volcanic activity at Shishaldin Volcano. The analysis is based on thermal infrared observations from the MODIS instruments aboard the Terra and Aqua satellites, using Level 1B radiance products (MOD021KM/MYD021KM), together with the corresponding geolocation products (MOD03/MYD03) and cloud mask products (MOD35/MYD35).
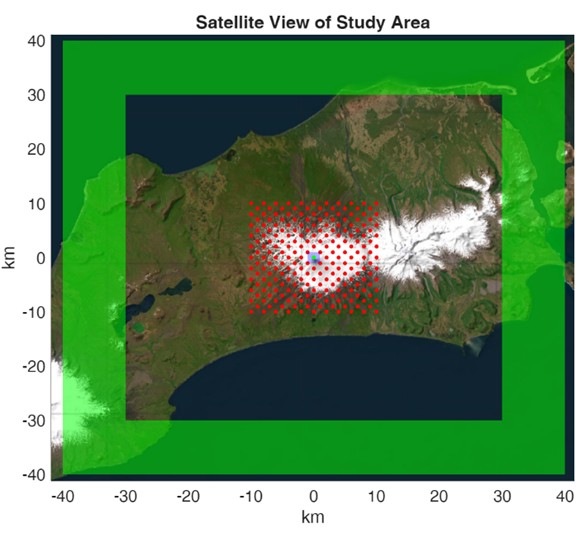
The analysis focuses on a region of interest (ROI) centered on the summit (54.756° N, 163.97° W) with a side length of 4 km. The reference area is defined as a hollow square centered on the summit, with inner and outer side lengths of 60 km and 80 km, respectively. This configuration captures spatially distributed thermal variations while preserving sensitivity to subtle changes.
Both daytime and nighttime observations are combined to maximize temporal coverage and data availability. Cloud-contaminated pixels are filtered using the MODIS cloud mask, after which the median brightness temperature is computed for both the ROI and the reference area, followed by the calculation of daily median values. A conservative acceptance threshold of 0% is adopted, ensuring that all scenes with available clear-sky observations are retained, which is particularly important for maintaining continuity in high-latitude environments with frequent cloud cover. The resulting time series is then processed using linear interpolation to fill data gaps.
To enhance the detection of long-term, low-amplitude signals, the time series is processed using a low-pass median filter with a 730-day cutoff period (backward window). This filtering step reduces short-term variability associated with environmental and atmospheric effects, while emphasizing persistent trends that may reflect underlying subsurface processes such as fluid circulation or thermal evolution within the volcanic system.
Uncertainty is quantified through bootstrapping using 100 iterations, enabling robust estimation of confidence intervals around the retrieved signal. In the resulting time series, the red line represents the median thermal anomaly, while the light red shaded area indicates the associated 95% confidence interval. Vertical blue bands mark the onset and duration of eruptive events, providing temporal context for the observed thermal variations and facilitating comparison between thermal signals and volcanic activity.
Latest Thermal Update